Apple Shares Have Rallied About 13% From Their August Low


Key Takeaways
-
Apple shares are likely to be in focus Monday as the tech giant hosts its “Glowtime” product launch event, where it is expected to unveil its new AI-powered iPhone alongside other devices and provide further information about major software updates.
-
Since bottoming out from a correction in early August, Apple’s stock has rallied around 13% leading into Monday’s showcase, raising the possibility of a sell-the-news event.
-
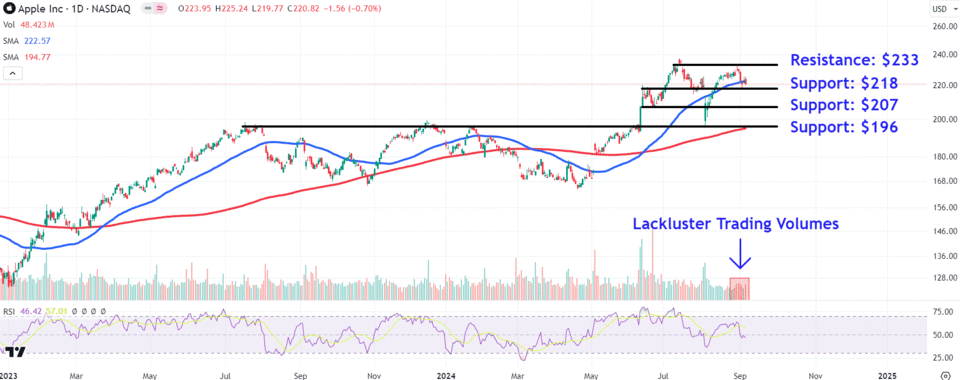
Investors should monitor important support areas on Apple’s chart at $218, $207, and $196, while watching how the stock responds to key overhead resistance at $233.
Apple (AAPL) shares will likely be in focus Monday as the tech giant hosts its “Glowtime” product launch event, where it is expected to unveil its new artificial intelligence (AI)-powered iPhone alongside other devices and provide further information about major software updates, including Apple Intelligence-enabled iOS 18.
Since bottoming out from a correction in early August, Apple’s stock has rallied around 13% leading into Monday’s showcase, raising the possibility of a sell-the-news event. Indeed, investment bank Morgan Stanley recently pointed out that the company’s shares tend to underperform the S&P 500 on the day of an iPhone launch event, but modestly outperform the market in the following three months.
Below, we’ll take a close look at Apple’s chart and use technical analysis to identify key price levels investors should watch out for amid the iPhone maker’s biggest event of the year.
Large Price Swings After Hitting New Record High
After minting a new record high in mid-July, the stock retraced as much as 17% to an early June breakout area before spending most of August recovering a significant portion of that decline.
More recently, the price closed Friday’s session below the 50-day moving average (MA), though trading volumes remain lackluster, indicating little conviction behind last week’s weakness. Apple shares fell 0.7% to $220.82 on Friday amid a broader downturn for technology stocks.
Moving forward, investors should keep a close eye on several important price levels that could come into focus.
Key Support Levels to Watch
Initial selling could see the shares test the $218 area, a location on the chart that finds support from a trendline connecting a range of trading activity positioned around the June peak and July trough.
An inability to hold this level could trigger a fall to $207, where investors may place buy limit orders near the June 11 breakout candlestick close, an area that also closely aligns with the June pullback low.
A more significant downside move may see the stock retest last month’s low at $196, where bargain hunters could look for buying opportunities near the initial breakout area that has potentially flipped from resistance into support and also sits in close proximity to the rising 200-day MA.
Important Resistance Level to Monitor
If Apple shares catch a bid leading into this week’s event, they could initially run into overhead resistance around $233, an area where investors could look to take profits near a range of similar trading levels positioned just below the stock’s all-time high (ATH).
The comments, opinions, and analyses expressed on Investopedia are for informational purposes only. Read our warranty and liability disclaimer for more info.
As of the date this article was written, the author does not own any of the above securities.
Read the original article on Investopedia.
