Bitcoin makes history, as a six-figure BTC price is finally here. Yet, investors might wonder how far the king of cryptocurrencies can actually go.
Technical Analysis
By Edris Derakhshi (TradingRage)
The Daily Chart
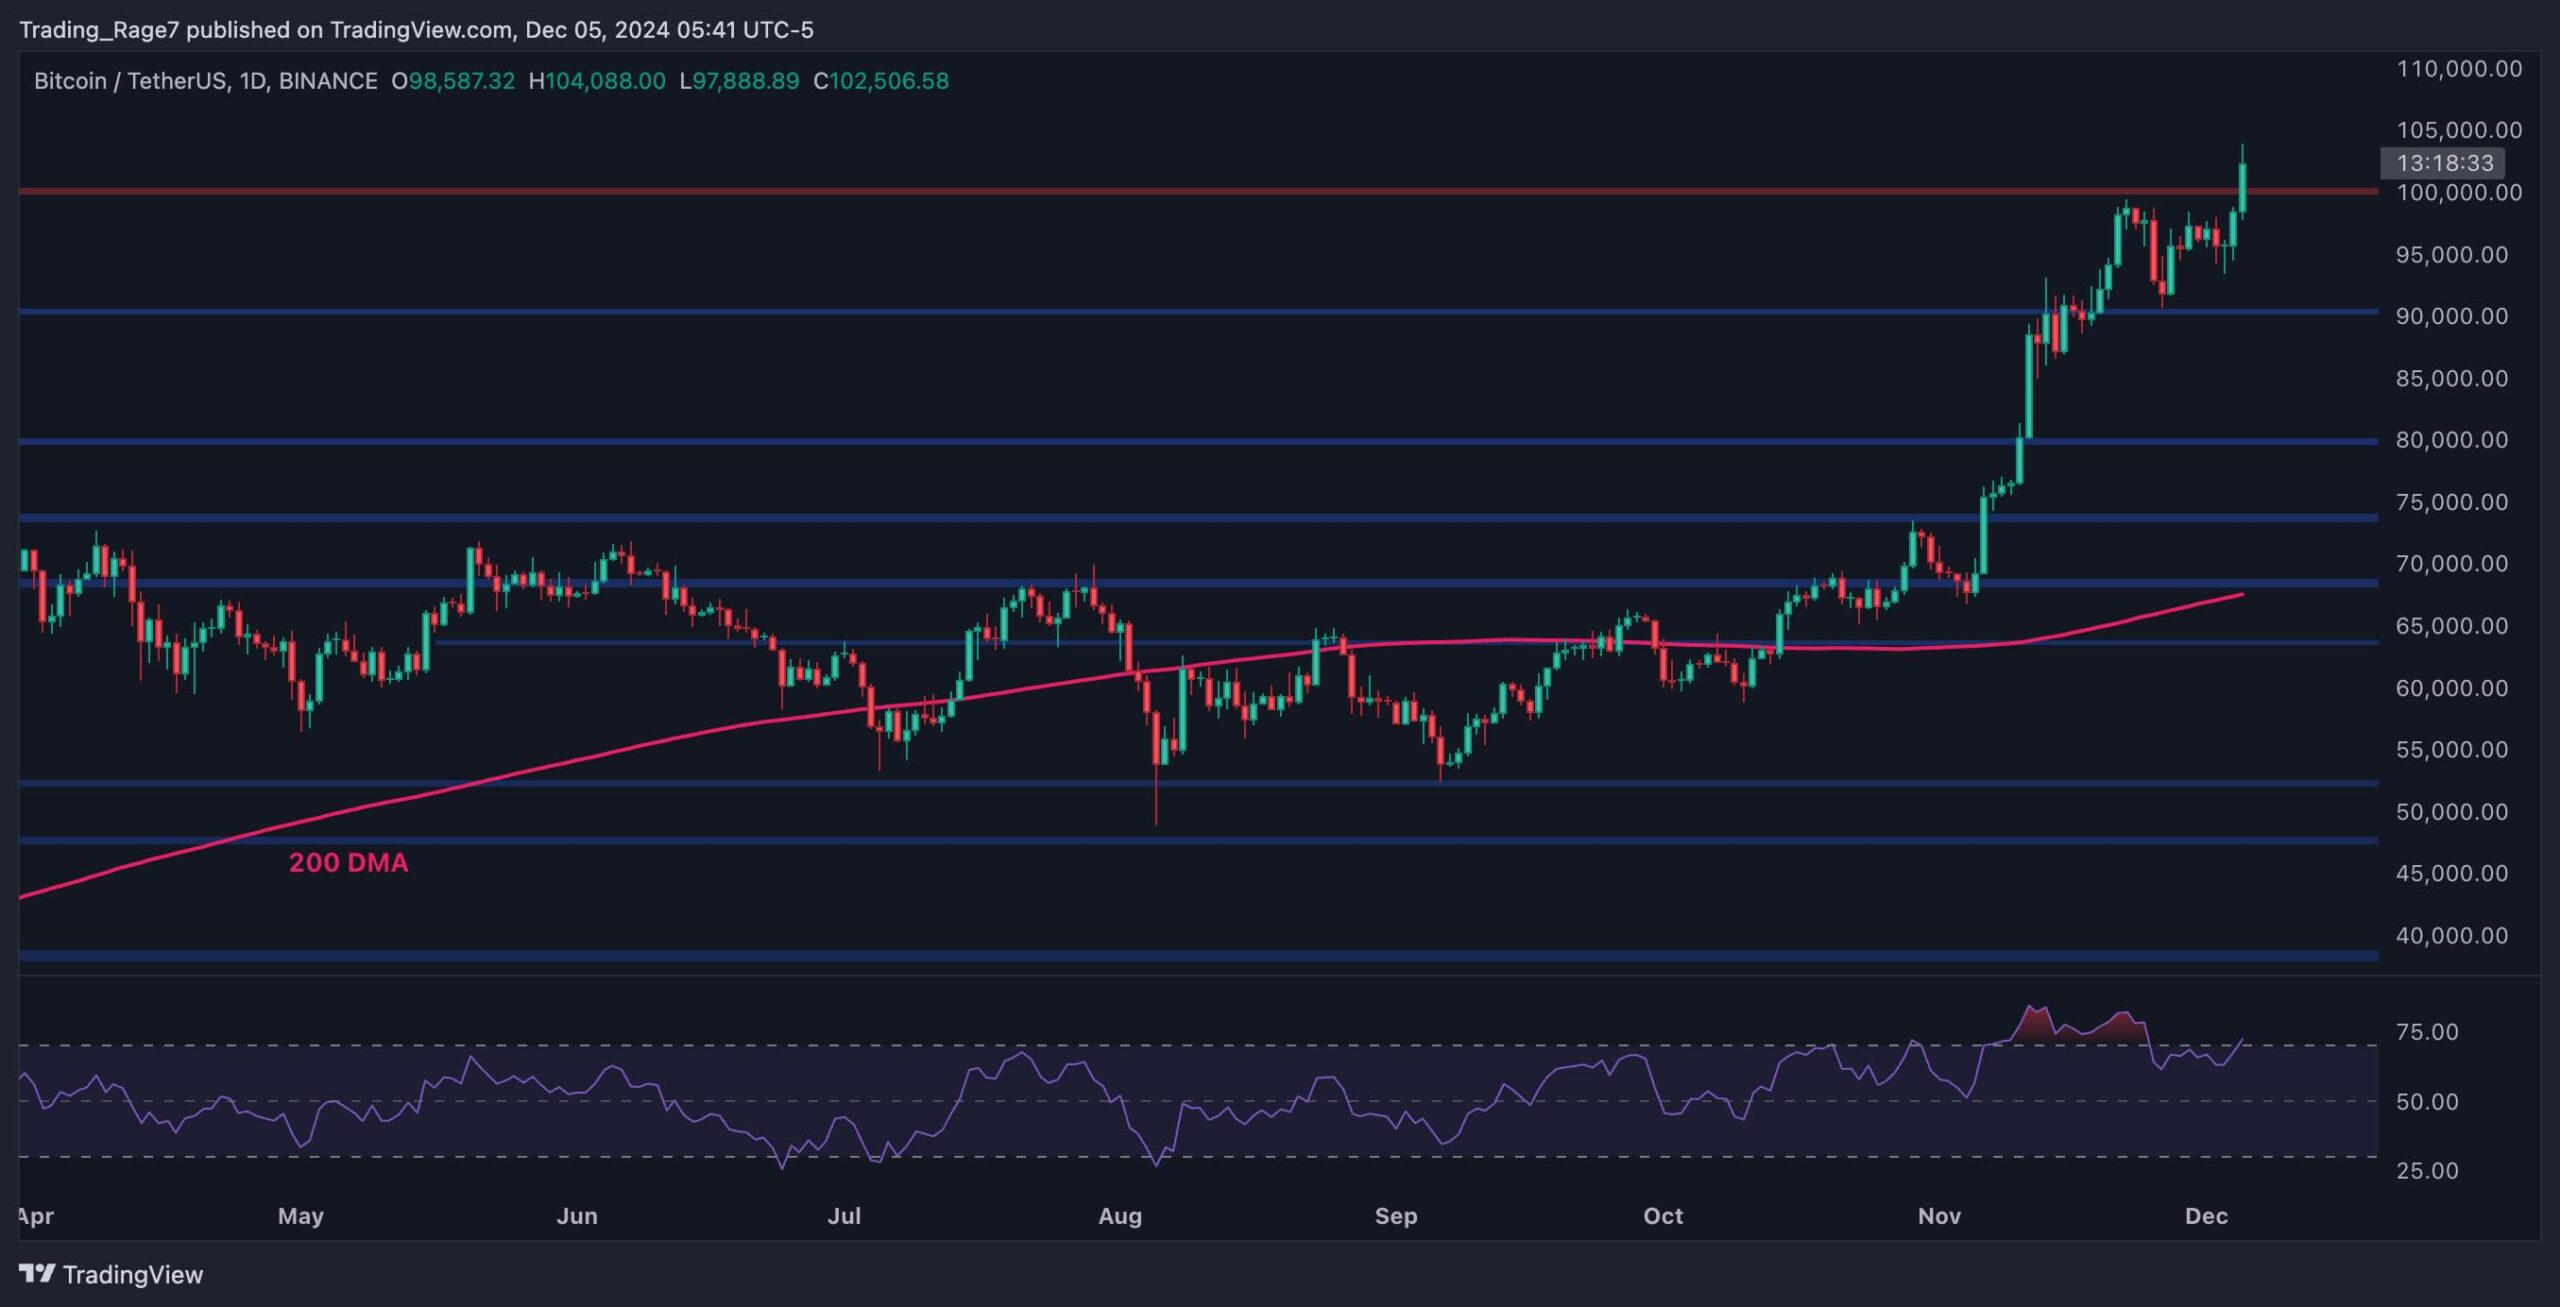
The daily chart shows that Bitcoin has finally broken through the 100K milestone today and is pushing toward the $105K level. With the market structure being so bullish, even a run toward the $120K area is possible in the short term.
Meanwhile, the RSI has once again entered the overbought region, and the 200-day moving average is also far behind the price, currently trending near the $70K mark. Therefore, there’s also a logical probability for a correction soon, which could present a buying opportunity.
The 4-Hour Chart
The 4-hour chart clearly shows the BTC price action over the last month. The market slowed down after breaking above the $90K resistance level, gradually increasing through higher highs and lows.
However, today’s breakout above $100K might lead to an aggressive continuation higher.
Meanwhile, with the RSI also entering the overbought zone in this timeframe, there is more evidence that a pullback might happen soon, which could see the price drop toward the bullish trendline and the $96K level before taking off again.
Sentiment Analysis
By Edris Derakhshi (TradingRage)
Funding Rates
As the futures market is arguably the most significant determining factor in Bitcoin’s short-term price movements, analyzing its overall sentiment would likely help investors form more accurate predictions.
This chart presents the funding rates, which measure whether buyers or sellers are executing their leveraged positions more aggressively.
While the metric is currently positive, indicating bullish momentum, this can also lead to a potential reversal. High funding rates are usually followed by a sudden drop as a result of long liquidation cascades.
With Bitcoin’s aggregate funding rates showing the highest level over the past year, a correction seems likely soon. This could also lead to a period of consolidation as the futures market cools down.
Binance Free $600 (CryptoPotato Exclusive): Use this link to register a new account and receive $600 exclusive welcome offer on Binance (full details).
LIMITED OFFER for CryptoPotato readers at Bybit: Use this link to register and open a $500 FREE position on any coin!
Disclaimer: Information found on CryptoPotato is those of writers quoted. It does not represent the opinions of CryptoPotato on whether to buy, sell, or hold any investments. You are advised to conduct your own research before making any investment decisions. Use provided information at your own risk. See Disclaimer for more information.
Cryptocurrency charts by TradingView.

